

The Best Way to Read Google Analytics
Google Analytics offers so much website data, it’s easy to get lost. You could easily stare at the Google Analytics dashboard for hours trying to figure out what it means. To ensure you are checking the most critical data of your website, here’s a helpful guide in maintaining efficiency while reviewing your website traffic statistics.Compare Dates
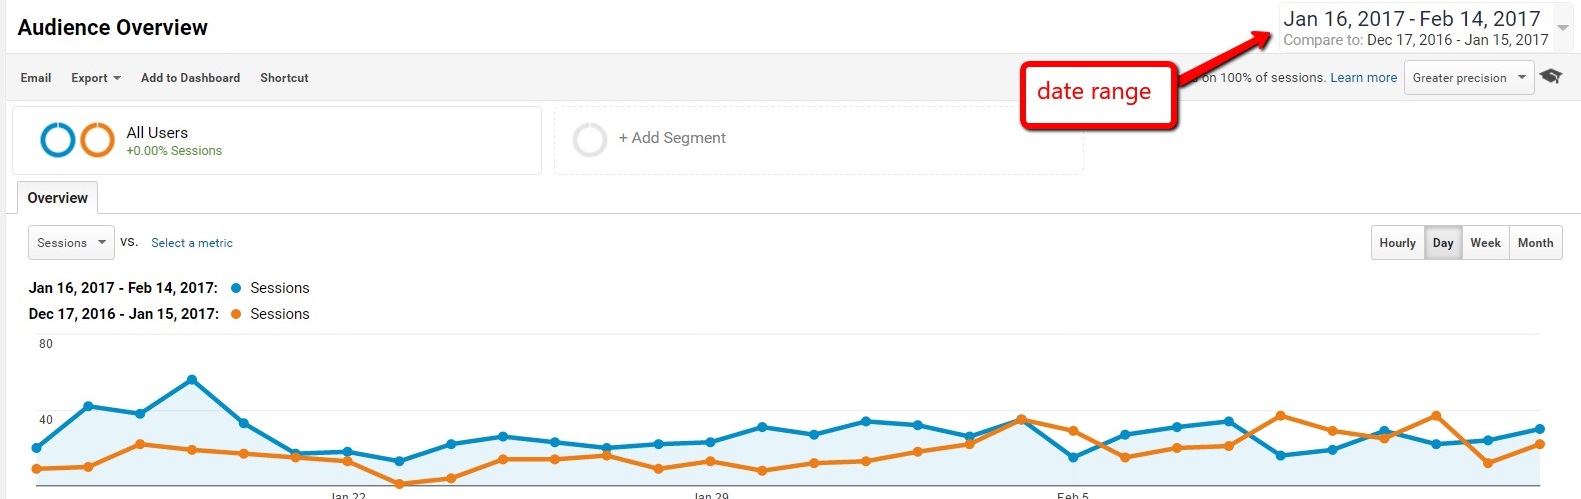
Comparing dates lets you check your website’s traffic against another time period. On the very top right side of the Google Analytics dashboard, you can select your desired date range and select the date range to compare it to. This function allows you to see the progress of your site over time. This also allows you to see benchmarks in the data. Some of the more popular date comparisons are:- This week versus last week
- This month versus last month
- The past 30 days versus the same 30-day period 1 year ago
- The past 30 days versus the 30 days after Google Analytics was installed on the site
Audience Overview
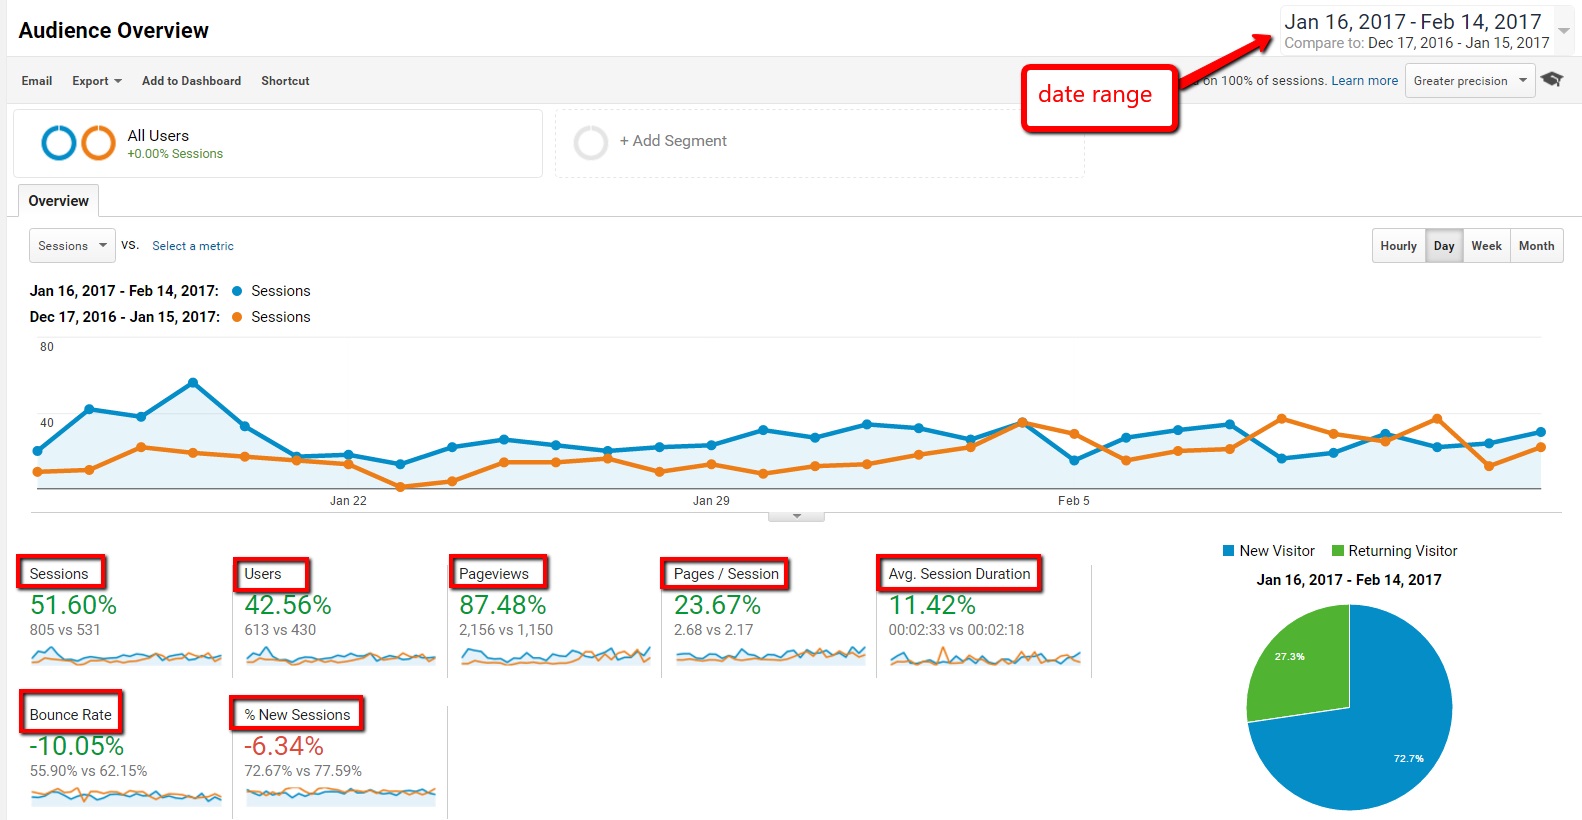
As soon as you log into Google Analytics, you will automatically see your website traffic audience overview. This gives you a great high-level perspective of the traffic to your website, including:- Total sessions – Look for an increase in numbers over time. An increase will be shown in green and a decrease in total sessions will be shown in red.
- Total users – You always want more users to your website, so look for green because that reflects an increase in numbers, while red shows a decrease in users.
- Page views – Depending on your strategy, you may want to see more page views per visit or less.
- Average pages per session – Just like page views, it can go either way because it also depends on strategy.
- Average session duration – Usually you would be looking for an increase (green) because that means more time is being spent on your site reading your content or simply browsing. If you’ve recently reorganized your site to make it easier to find popular pages, you may see a decrease in time on site — that would be a good sign that visitors are finding what they want faster.
- Bounce rate – You’ll always want to see bounce rate decrease. A bounce is when a visitor comes to your site and leaves without visiting a second page before exiting. A decreasing bounce rate is green while increasing bounce rate is red. Average website bounce rate is 50%, but the lower the bounce rate the better.
- Percentage of new sessions – You’ll always want an increase in numbers here. The more new sessions the better: that means more people, who’ve never been to your site before, are visiting your website.
Acquisition
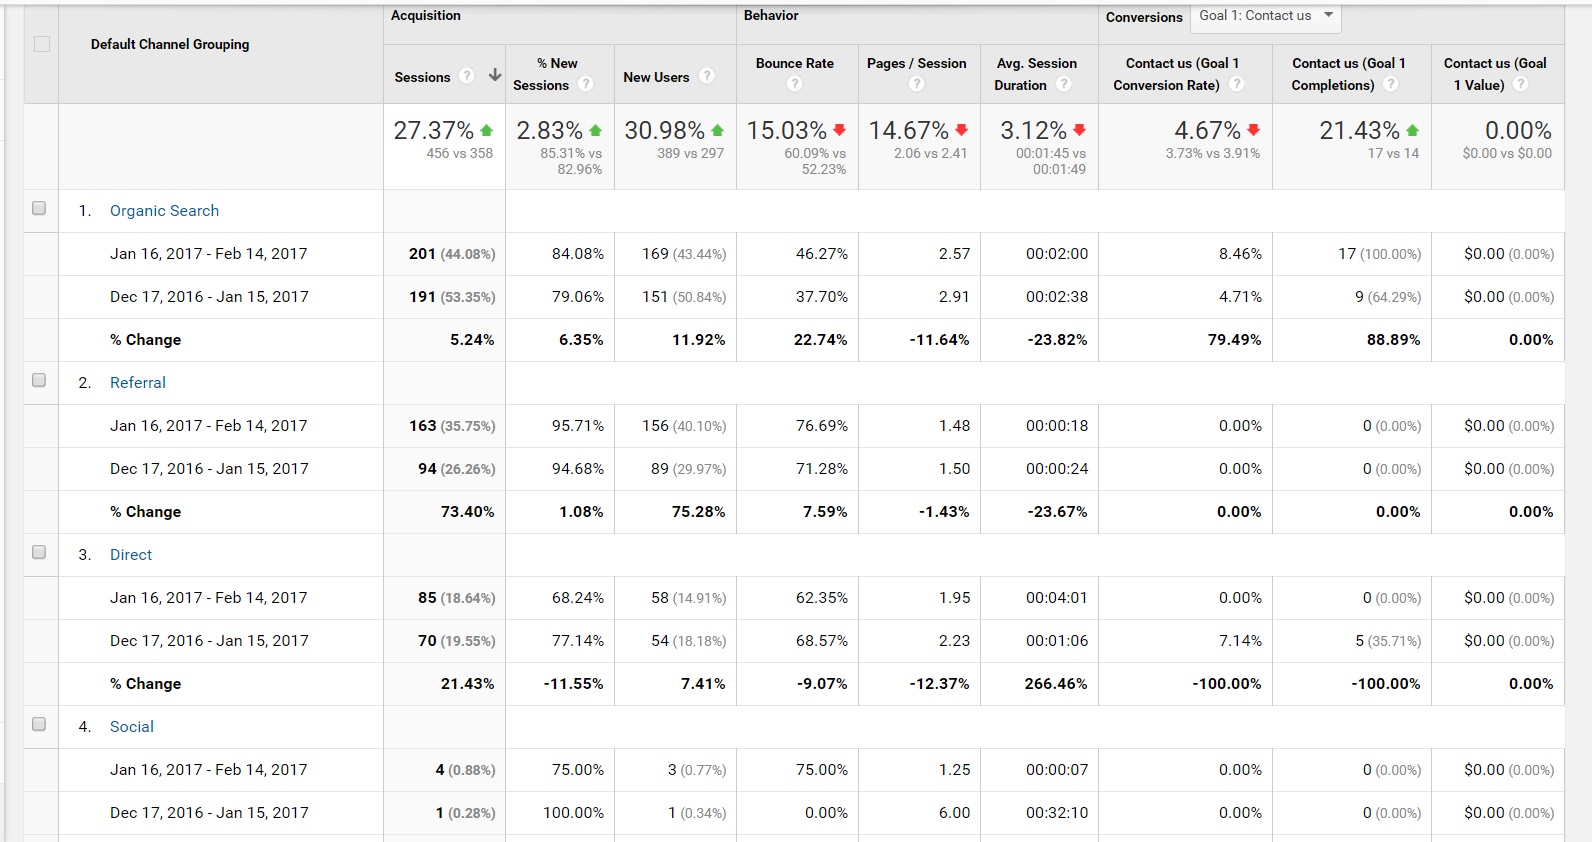
The Acquisition section shows how website visitors found your site. It lets you know if they found your site through a search, from a social network, whether they typed the URL into the address bar, or if they were referred from another website. The acquisition method is important because it lets you know what marketing initiatives are actually driving traffic to your site. The best view is Acquisition > All Traffic > Channels. Here’s what you’ll likely see:- Organic Search – This shows visitors who conducted a keyword search, noticed your website within the search results for that specific keyword, and then clicked on your site.
- Direct – This is when a visitor types in your website URL to go directly to your website.
- Social Network – This is when a visitor is on one of your social networks and then links over to your site. This is why it’s important that you leverage social networks to link people to your website.
- Referral – This is when a visitor arrives at your site from another website such as Yelp, YellowPages.com, a local chamber of commerce website, and other directory websites.
Device
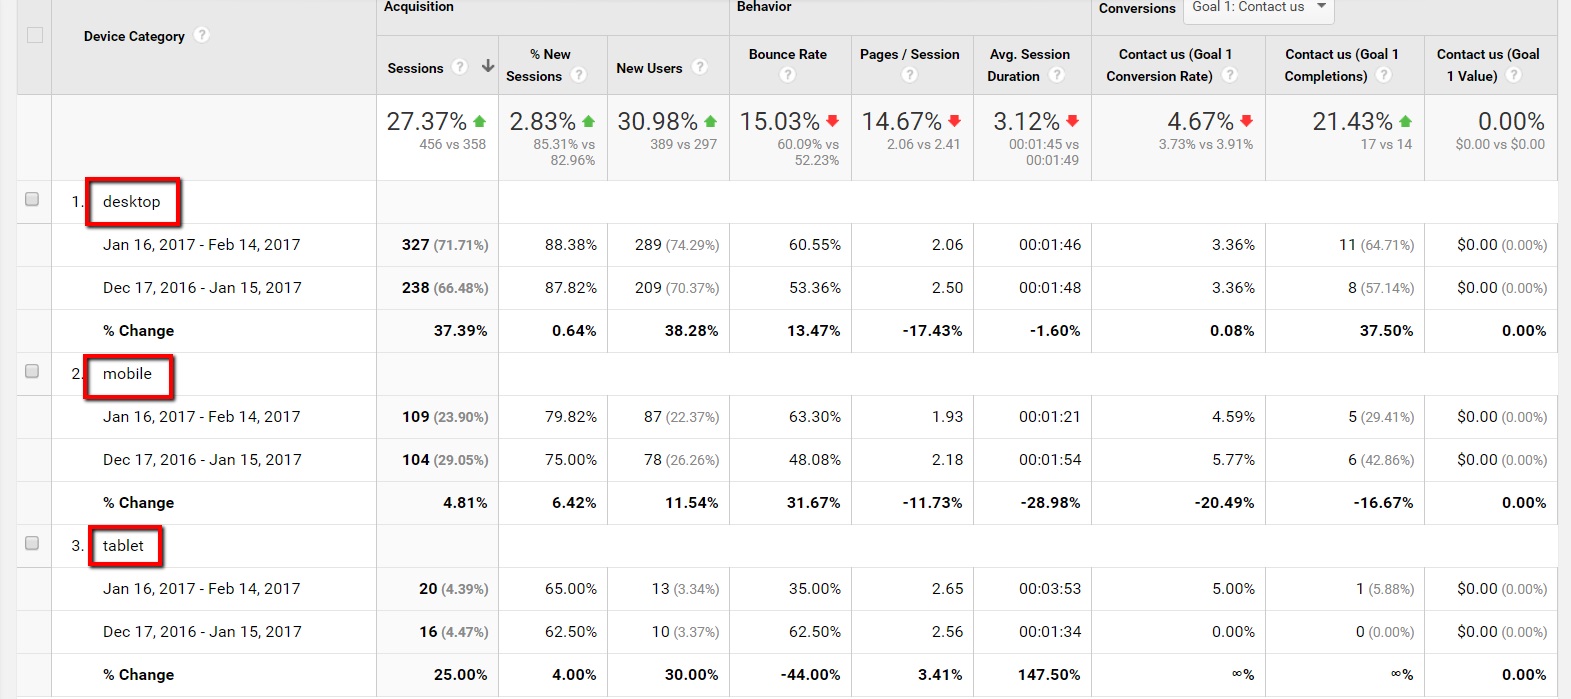
Using Google Analytics, you can see what device visitors are accessing your site from. Whether it be a desktop/laptop, tablet, or smartphone, understanding the device that your site is accessed from helps you ensure the user experience is positive for all devices that drive traffic to your site. It’s usually a combination of all 3 and you can access this view by clicking on Audience > Mobile > Overview:- Desktop – The visitor used a desktop or a laptop computer.
- Tablet – The visitor used an iPad, a tablet, or an eReader.
- Mobile – The visitor accessed your website from their personal smartphone device.
Most Visited Pages
Understanding what pages are more popular on your website is critical to helping your website succeed. The most visited page is usually the homepage, so you’ll want to pay close attention to the second, third and fourth most popular pages. This ensures the experience on those pages help your visitor travel down the marketing funnel towards your goals, such as filling out a form, signing up for a newsletter, downloading a coupon, or giving you a call. To see what are the most popular pages in your Google Analytics dashboard easily, go to Behavior > Site Content > All Pages. Here’s an example of what it looks like: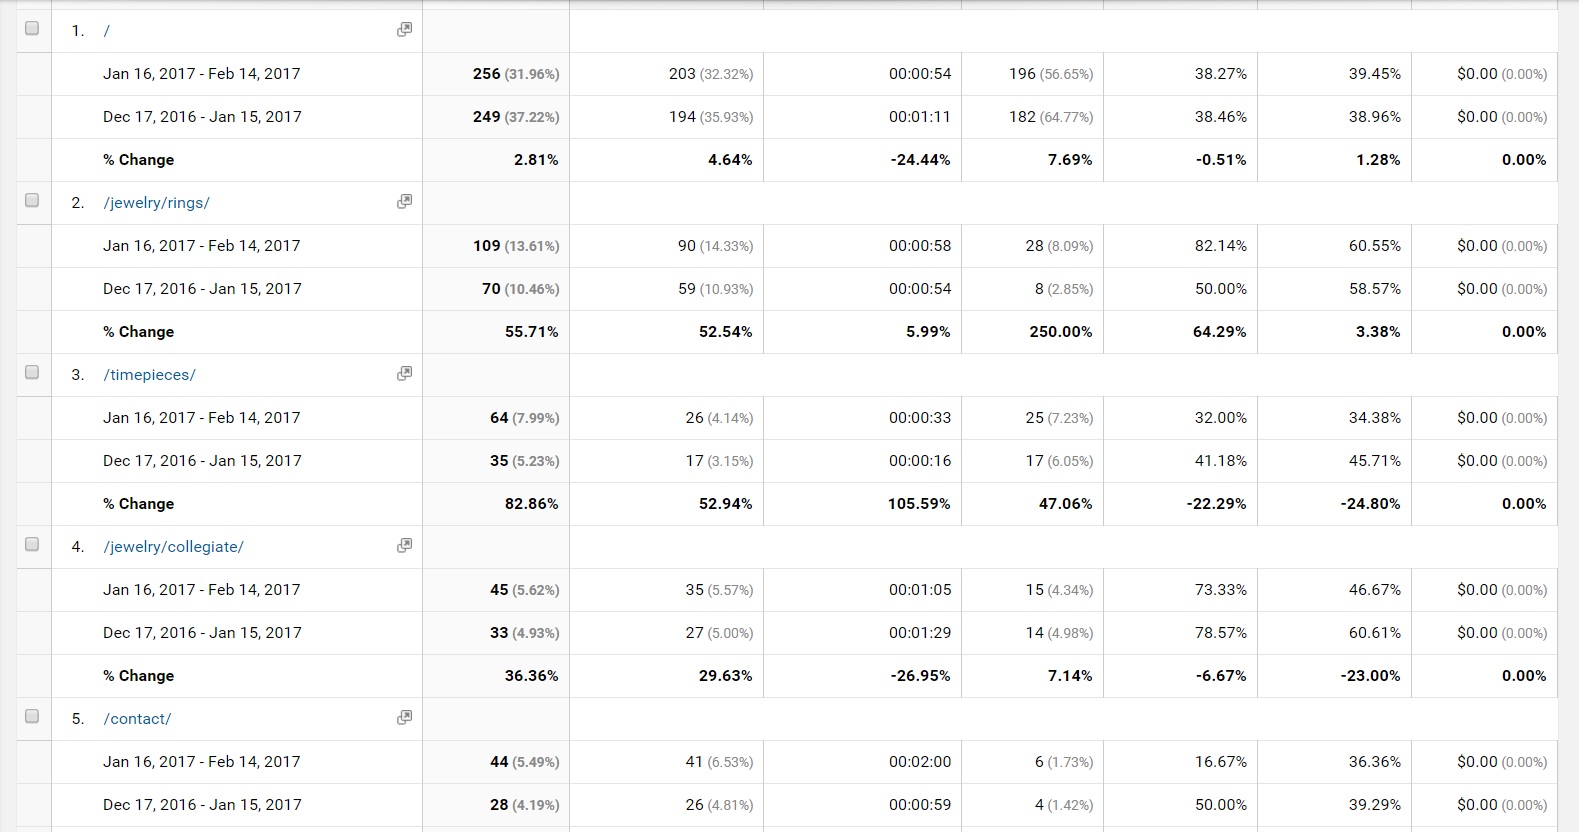
Final Word on Analyzing Google Analytics
If you are looking for a professional digital marketing agency to help make sense of your Google Analytics website traffic, please call TheeDigital at 919-341-8901 or click here to schedule a consultation with one of our web experts today.
Tags: Digital Marketing • Google